The public debate on social mediaIl dibattito pubblico sui social media
* Questi autori hanno contribuito equamente allo studio.
1 Istituto dei sistemi complessi CNR Roma 2 Università Ca' Foscari di Venezia 3 Ospedale Pediatrico Bambino Gesù, Roma 4 Center for the Humanities and Social Change, Venezia
+e-mail: fabiana.zollo@unive.it
Una delle sfide poste dall'emergenza sanitaria in corso consiste nel comprendere come le persone si informano, selezionano e percepiscono le notizie e, possibilmente, come questo incide sulle loro decisioni. In questo report, aggiornato periodicamente, proviamo a delineare lo scenario informativo su COVID-19 caratterizzando la diffusione e la percezione dei contenuti riguardanti l'argomento sulle principali piattaforme social a partire dal 3 gennaio 2020, giorno in cui la Cina ha informato l'OMS della diffusione di una misteriosa polmonite nella provincia dell'Hubei.
* These authors contributed equally to the study.
1 Istituto dei sistemi complessi CNR Roma 2 Università Ca' Foscari di Venezia 3 Ospedale Pediatrico Bambino Gesù, Roma 4 Center for the Humanities and Social Change, Venezia
+e-mail: fabiana.zollo@unive.it
One of the challenges in the ongoing medical emergency is to understand how people get informed, select and perceive information and, possibly, how this influences their decisions. In this report, which will be updated periodically, we aim to outline the information scenery on COVID-19 characterizing news spreading and perception on coronavirus on the main social media platforms starting from January, 3rd 2020, the day when China reported to WHO a cluster of mysterious pneumonia cases in the Hubei province.
Before startingPrima di iniziare
In this page you will find many interactive charts. Hovering the mouse over a graph, you will visualize extra data and information. In the top right corner of each graph you will find a toolbar. Each tool allows you to customize your interactive experience with the data. For example, you can select, zoom in/out, export the chart as an image, or toggle spike lines. We would suggest you to try the different tools to find the visualization mode that matches your needs.
In questa pagina troverai diversi grafici interattivi. Facendo scorrere il mouse sul grafico, diverse informazioni aggiuntive compariranno in sovraimpressione. Ogni grafico presenta in alto a destra una barra degli strumenti. Questi strumenti ti consentono di personalizzare la tua esperienza di interazione con i dati presentati. Ad esempio, puoi selezionare, ingrandire o ridurre alcune aree del grafico, scegliere quali informazioni mostrare, abilitare le linee guida o esportare il grafico come immagine. Ti invitiamo a provare i diversi strumenti per trovare la modalità di visualizzazione che più si adatta alle tue esigenze.
Who talks about coronavirus? How much?Chi parla di coronavirus? E quanto?
We begin our study by analyzing how different information sources covered coronavirus in their social media accounts. We distinguish between the following categories of news sources:
- News agencies
- Scientific sources
- Institutions, i.e., institutional communication channels (e.g., Facebook page of the Ministry of Health)
- Newspapers
- Radios
- Digital native news outlets
- TVs
- Misinformation, i.e., sources of misinformation as identified by independent parties specialized in debunking activities
For more information, please refer to the methodological notes at the end of this page.
Figure 1 shows the percentage of weekly posts published on Facebook, Instagram and Twitter on the topic of coronavirus. While in the first weeks of the emergency the percentage of content on COVID-19 was less than 10% on all the platforms, with the first cases confirmed in Lombardy (february 20, 2020) this fraction quadruples, remaining for over two months above 25% on Facebook, 30% on Twitter and 45% on Instagram, with peaks of 40, 50 and 65%, respectively. It is worth noting that Instagram reaches the highest percentages although, with an average of 2,960 posts per week, it is the least used channel, followed by Twitter with 33.930 and Facebook with 78,150.
Il nostro studio parte dall'analisi dello spazio mediatico dedicato al coronavirus dalle diverse fonti di informazione sui propri canali social. Le fonti di informazione considerate sono suddivise nelle seguenti categorie:
- Agenzie di informazione
- Fonti scientifiche
- Istituzioni, ovvero canali di comunicazione istituzionale (es: pagina Facebook del Ministero della Salute)
- Quotidiani
- Radio
- Testate native digitali
- TV
- Disinformazione, ovvero fonti di disinformazione individuate come tali da soggetti indipendenti specializzati in attività di debunking
Per maggiori informazioni, puoi far riferimento alle note metodologiche in fondo a questa pagina.
La Figura 1 mostra la percentuale di post settimanali pubblicati rispettivamente su Facebook, Instagram e Twitter sul tema coronavirus. Se nelle prime settimane di emergenza la percentuale di contenuti COVID-19 rimaneva inferiore al 10% su tutte le piattaforme, dopo la notizia dei primi casi confermati in Lombardia (20 febbraio 2020) tale frazione quadruplica, rimanendo per oltre due mesi sopra il 25% su Facebook, il 30% su Twitter e il 45% su Instagram, con punte rispettivamente del 40, 50 e 65%. È interessante notare come Instagram raggiunga le percentuali maggiori sebbene, con una media di 2,960 post settimanali, sia il canale meno utilizzato dall'insieme di fonti considerate, seguito da Twitter e Facebook, rispettivamente con 33,930 e 78,150 contenuti.
Figure 2a shows the percentages of Figure 1 divided by type of source. We can see that the main contributions come from institutions, newspapers and digital news outlets. Misinformation on COVID-19 is more present on Facebook than on the other platforms, although it remains constantly below 4% with an average of about 3,040 weekly posts starting from February, 23. As a percentage, Radios and TVs posted more COVID-19 content on Instagram, while news agencies mainly used Twitter. Scientific sources, on the other hand, contributed only marginally to the discussion of the COVID-19 topic on social media (less than 0.2% on Facebook and Twitter and less than 2% on Instagram during the entire period analyzed). This confirms that the times of science are very different from those of journalism and not consistent with the early solutions required during health emergencies such as the one in progress.
La Figura 2a mostra le percentuali della Figura 1 divise per tipo di fonte. Possiamo notare come i contributi maggiori provengano da istituzioni, quotidiani e testate digitali. La disinformazione su COVID-19 sembra essere più presente su Facebook rispetto alle altre piattaforme, sebbene rimanga comunque costantemente sotto il 4% con una media di circa 3,040 post settimanali a partire dal 23 febbraio. Radio e TV hanno in percentuale postato più contenuti COVID-19 su Instagram, mentre le Agenzie di informazione hanno utilizzato principalmente Twitter. Le fonti scientifiche hanno invece contributo solo marginalmente alla discussione dell'argomento COVID-19 sui social (meno dello 0.2% su Facebook e Twitter e meno del 2% su Instagram durante tutto il periodo analizzato). Questo conferma come i tempi della scienza siano ben diversi da quelli del giornalismo e incompatibili con l'urgenza di soluzioni richiesta durante emergenze sanitarie come quella in corso.
Figure 2b shows the percentage of weekly COVID-19 content related to the type of source on Facebook, Instagram and Twitter, respectively. Namely, the graphs indicate how much space each type of source has devoted weekly to the coronavirus theme on each social media. Except for the few posts published on Instagram, both misinformation and scientific sources have never exceeded the 40% threshold on Facebook and Twitter, even during the weeks of maximum emergency between mid-march and mid-april.
La Figura 2b mostra la percentuale settimanale di contenuti COVID-19 relativa al tipo di fonte su Facebook, Instagram e Twitter. In altre parole, i grafici indicano quanto spazio ogni tipo di fonte abbia dedicato settimanalmente al tema coronavirus su ciascuna piattaforma. Fatta eccezione per i pochi post pubblicati su Instagram, sia fonti di disinformazione che fonti scientifiche non hanno mai superato la soglia del 40% su Facebook e Twitter, nemmeno durante le settimane di massima emergenza comprese tra metà marzo e metà aprile.
What do they talk about?Di cosa si parla?
In this section we analyze the most used words and the main topics of discussion on COVID-19 by information (news agencies, scientific sources, institutions, newspapers, radios, digital news outlets and TVs) and misinformation, respectively, on Facebook, Instagram and Twitter.
The wordclouds below show that information sources rely on most terms related to contagion data and restriction measures, while among source of misinformation, terms related to the international situation, hypotheses on the origin of contagion and the scientific debate are more frequent.
In questa sezione analizziamo i termini più utilizzati e gli argomenti più discussi nei post dedicati a COVID-19 su Facebook, Instagram e Twitter rispettivamente dall'insieme delle fonti di informazione (agenzie di informazione, fonti scientifiche, istituzioni, quotidiani, radio, testate digitali e TV) e dalle fonti di disinformazione.
Le wordcloud qui sotto mostrano come le fonti di informazione utilizzino maggiormente termini legati all'andamento del contagio (casi, positivi, decessi, tamponi) e alle misure adottate dalle istituzioni per fronteggiare l'emergenza (decreto, presidente, Conte, regione, comune, ordinanza, controlli), mentre tra le fonti di disinformazione sono più frequenti termini legati alla situazione internazionale (pandemia, Cina, Germania, Francia, Russia, Trump, Sanders, Netanyahu), ad ipotesi sull'origine del contagio (laboratorio, militare, bufala, Wuhan) e al dibattito scientifico (guarigioni, esperti, scienziati, studio, proteasi, ferro, temperature, caldo).
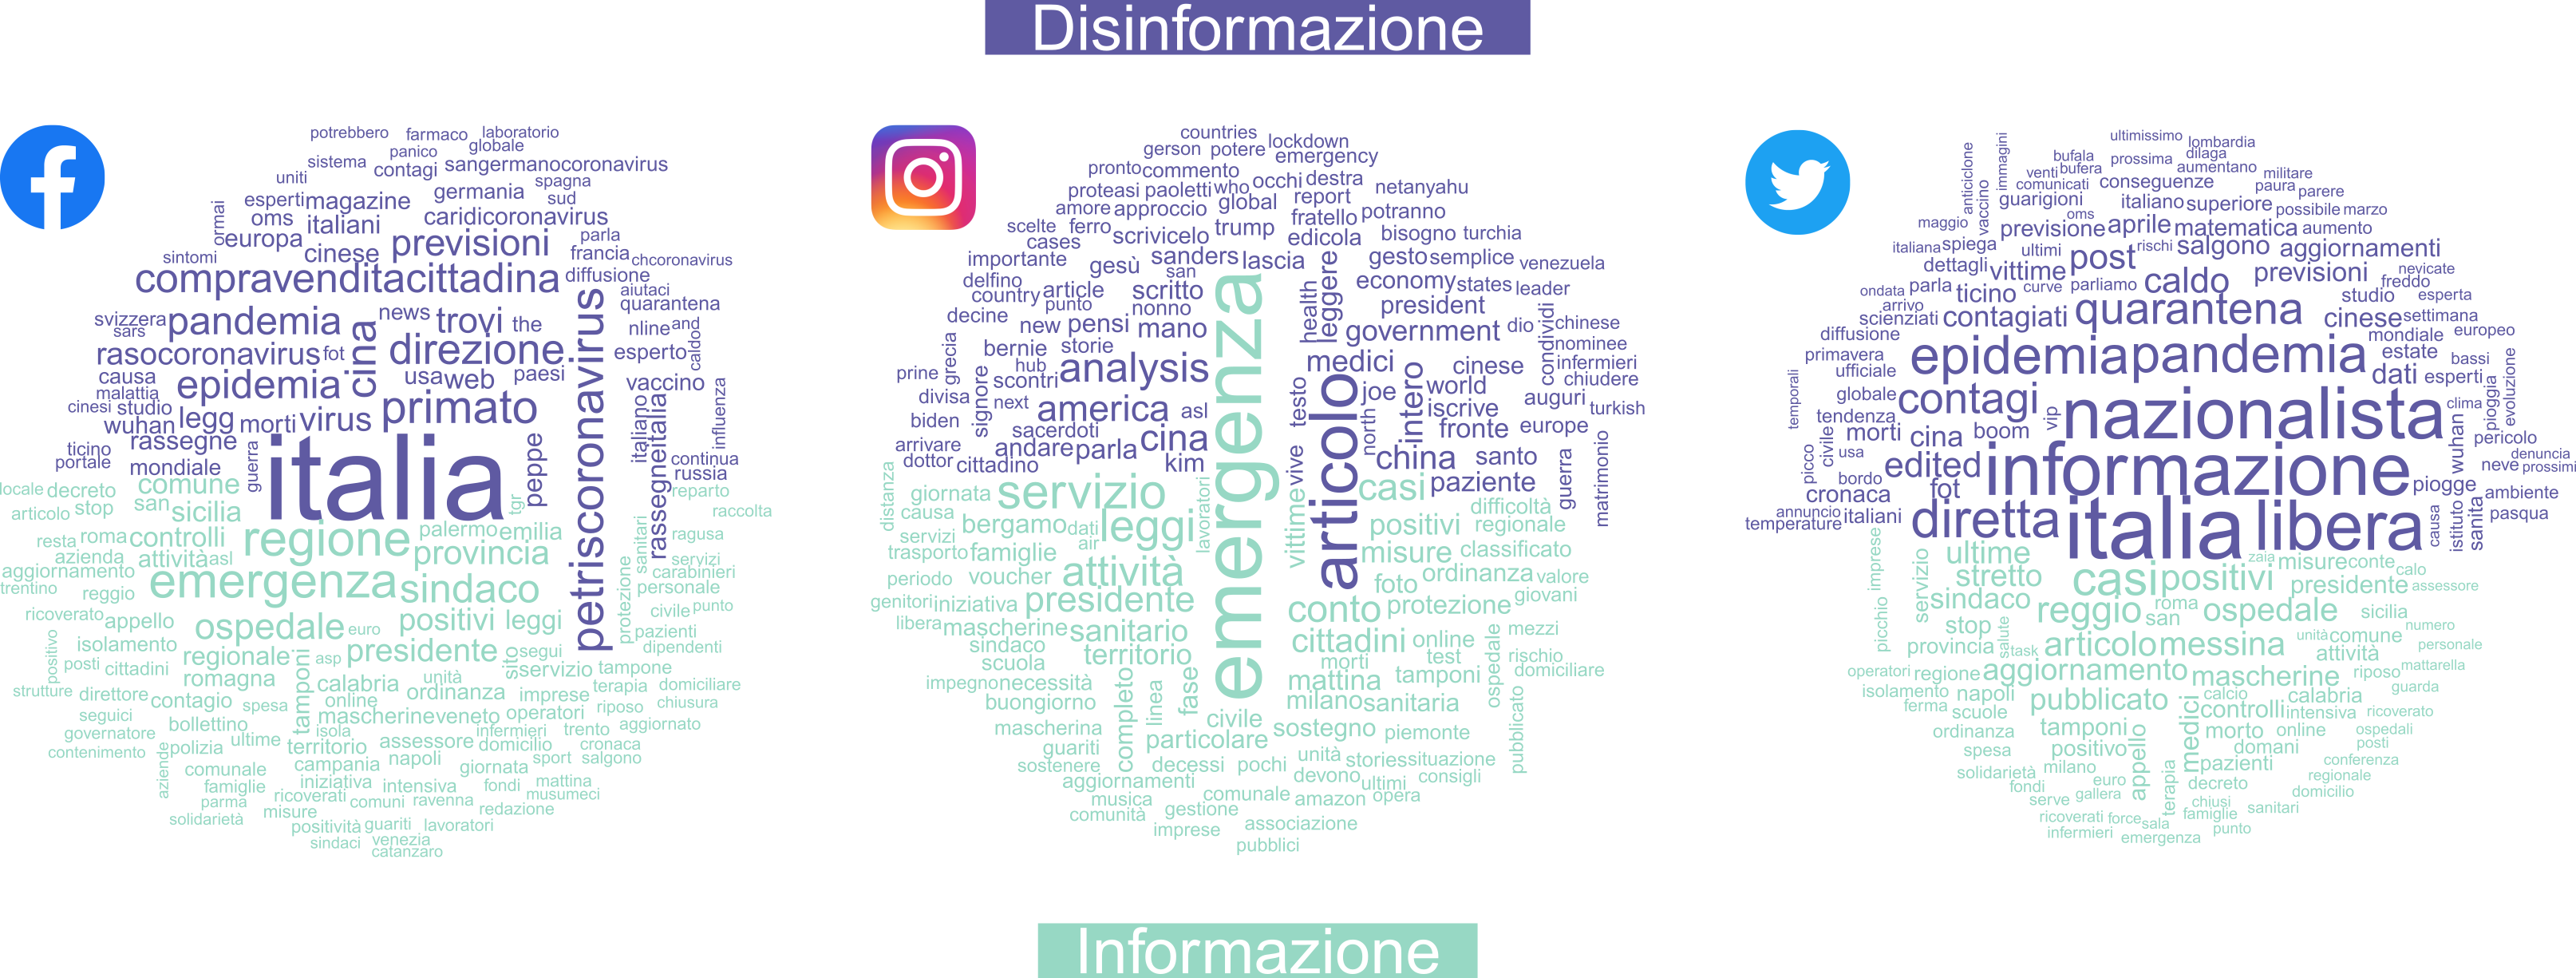
Figure 3 shows in detail the main arguments on COVID-19 discussed by information and misinformation sources, respectively, on Facebook, Instagram and Twitter. The different topics have been detected by means of structural topic modeling and, for easing their comparison, are ordered according to the coverage on Facebook among misinformation sources.
Contagion data (Trend dei contagi) and the Measures provided by the various Prime Ministerial Decree (Misure previste dai vari DPCM) are the most discussed topics by both Information and Misinformation with the maximum proportion of 13, 15 and 17% on Facebook, Instagram and Twitter, respectively. Basically, the topics identified receive similar attention from both source selections. Noteworthy differences in favor of Information mostly concern topics of public interest such as Regional provisions (Provvedimenti regionali) and the surveillance and complaints submitted by policyholders during lockdown (Controlli e denunce). On the contrary, the topics preferred by Misinformation are mainly related to the polarizing nature of the argument, such as the origin story of coronavirus (Origine del virus), the possible relationship between virus and climate change (Relazione ambiente-virus) and, especially on Instagram, the coronavirus crisis in the US.
La Figura 3 mostra in dettaglio le principali tematiche trattate rispettivamente da fonti di informazione e disinformazione nei post dedicati all'argomento COVID-19 sulle tre piattaforme considerate. I diversi argomenti sono stati ottenuti utilizzando tecniche di topic modeling strutturale e, per facilitarne il confronto, sono ordinati in base al livello di copertura tra le fonti di disinformazione su Facebook.
Trend dei contagi e Misure previste dai vari DPCM sono gli argomenti più discussi sia da fonti di informazione che disinformazione con percentuali massime del 13, 15 e 17% rispettivamente su Facebook, Instagram e Twitter. Sostanzialmente, quasi tutti i temi individuati ricevono attenzione simile da entrambe le selezioni di fonti. Differenze degne di nota a favore di Informazione riguardano per lo più temi di interesse pubblico come Provvedimenti regionali e Controlli e denunce. Al contrario, le tematiche preferite da disinformazione sono legate soprattutto alla natura polarizzante dell'argomento, come ad esempio le ipotesi sull'Origine del virus, la possibile relazione ambiente-virus (smog, cambiamento climatico,…) e, principalmente su Instagram, la situazione USA.
What do the users think?Cosa ne pensano gli utenti?
In this last section we want to analyze how Facebook users interacted with content of different news sources during the COVID-19 outbreak.
Figure 4 shows the percentage of weekly overperforming posts over the total, by type (COVID-19 and non-COVID-19) and source category. Facebook posts are said overperforming when they get more engagement than standard posts, i.e., when they get more likes, comments, reactions, and shares than the average content published on the same page. By means of this new metric we can understand if COVID-19 posts get more or less attention than other content, moreover the different panels of Figure 4 allow us to compare differences between source types.
With the spreading of the epidemic and until the end of march, information on COVID-19 gains more and more engagement for all source types. To the contrary, other contents everywhere show a constant or decreasing overperforming trend. Nevertheless, during this period, only the COVID-19 posts of the institutional Facebook pages outperform the other contents. The fact that this overtaking does not happen for any other type of source, shows how the attention of Facebook users remains high even on non-COVID-19 contents. This is surprising, especially for scientific information sources, for which one would expect a greater interest from users for coronavirus information. Instead, for these sources the percentage of overperforming posts on COVID-19 always remains under 12%.
In quest'ultima sezione proviamo ad analizzare quanto e come gli utenti Facebook hanno interagito con i contenuti pubblicati dalle diverse fonti informative durante l'emergenza COVID-19.
La Figura 4 mostra la percentuale settimanale di post overperforming rispetto al totale, per tipologia e tipo di fonte. Sono detti overperforming i post Facebook che ottengono più engagement rispetto alla norma, ovvero i contenuti che ricevono più attenzione in termini di mi piace, commenti, reazioni, e condivisioni, rispetto alla media dei contenuti pubblicati sulla stessa pagina. Questa nuova metrica ci permette di comprendere se i post su COVID-19 ricevono più o meno attenzione rispetto al resto dei contenuti della pagina, mentre la suddivisione di Figura 4 consente di valutare le differenze tra le diverse tipologie di fonti informative.
Con l'inizio dell'epidemia e fino alla fine di marzo, i contenuti sul coronavirus guadagnano engagement per tutti i tipi di fonte. Al contrario, tutti gli altri contenuti mostrano ovunque un overperforming trend costante o decrescente. Tuttavia, durante tale periodo, solo i contenuti COVID-19 delle pagine Facebook istituzionali ottengono performance superiori a quelle degli altri contenuti. Il fatto che questo sorpasso non avvenga per nessun altro tipo di fonte, mostra come l'attenzione degli utenti Facebook rimanga alta anche su contenuti non riguardanti il coronavirus. Ciò è particolarmente sorprendente per le fonti di informazione scientifica, per le quali ci si aspetterebbe un maggiore interesse degli utenti rispetto ai contenuti sul coronavirus, e per le quali invece la percentuale di post COVID-19 overperforming rimane sempre inferiore al 12%.
Finally, we analyze users' reactions to coronavirus content on Facebook. Figure 6 shows the percentage of users that left a certain reaction (like, love, wow, haha, sad, angry) to posts published by Information (dashed line) and Misinformation (solid line) sources. The distribution of reactions to posts from both categories is similar, however we can observe a neat tendency of users to react to misinformation content expressing anger and wonder.
Analizziamo, infine, le reazioni degli utenti Facebook ai contenuti su COVID-19. La Figura 5 illustra la percentuale di utenti che hanno lasciato una certa reazione (tra “mi piace”, “love”, “wow”, “haha”, “sigh”, “grrr”) a post pubblicati da fonti di informazione (linea tratteggiata) e a post pubblicati da fonti di disinformazione (linea compatta). La distribuzione delle reazioni ai post delle due tipologie di fonti è comparabile, sebbene sia possibile osservare una netta preferenza degli utenti a reagire esprimendo rabbia e stupore rispetto ai contenuti delle fonti di disinformazione.
Future developmentsSviluppi futuri
This report will be constantly being updated. We will keep updating the graphs with recent data and we are planning (very soon) to complete the set of social media platforms with YouTube.
Questo report è in costante aggiornamento. Aggiorneremo periodicamente i grafici con nuovi dati, e pianifichiamo di completare l'insieme di piattaforme social da analizzare includendo anche YouTube.
Methodology notesNote metodologiche
The results shown in this study are based on the analysis of two datasets:
- AGCOM Data: document database built starting from data extracted through the platform developed by Volocom Technology. In particular, we analyzed the textual content of documents generated in Italy (01/01/2020 - 19/05/2020) from the social media accounts (Facebook e Twitter) of 662 information sources (Italian TV and radio channels, newspapers, news agencies, digital news outlets) and misinformation sources identified as such by independent parties specialized in debunking activities.
- CrowdTangle Data: data of Facebook pages (posts, number of likes, reactions, shares, comments) of 800 information sources (Italian TV and radio channels, newspapers, news agencies, digital news outlets, institutional communication channels) and misinformation sources identified as such by independent parties specialized in debunking activities.
The textual contents related to COVID-19 is identified by using lists of tokens (hashtags, keywords and phrases) created especially for this aim.
The textual analysis of Section "What do they talk about?" is performed by removing all the tokens used for filtering the contents related to COVID-19.
I risultati riportati in questo studio sono ottenuti analizzando due dataset:
- Dati AGCOM: database documentale costruito a partire dai dati estrapolati attraverso la piattaforma sviluppata da Volocom Technology. In particolare, è stato analizzato il contenuto testuale di documenti generati in Italia (dal 1° gennaio 2020 al 19 maggio 2020) dai canali social (Facebook e Twitter) di più di 662 fonti informative (canali televisivi e radiofonici nazionali, quotidiani, agenzie di stampa, testate esclusivamente online) e fonti di disinformazione individuate come tali da soggetti esterni specializzati in attività di debunking.
- Dati CrowdTangle: dati relativi alle pagine Facebook (post, numero di like, reazioni, condivisioni, commenti) di 800 fonti informative (canali televisivi e radiofonici nazionali, quotidiani, agenzie di stampa, testate esclusivamente online, canali istituzionali) e fonti di disinformazione individuate come tali da soggetti esterni specializzati in attività di debunking.
I contenuti relativi a COVID-19 sono stati filtrati utilizzando liste di token (hashtags, parole chiavi e frasi) create appositamente.
Le analisi testuali alla sezione "Di cosa si parla?" sono state eseguite eliminando i token utilizzati per filtrare i contenuti relativi a COVID-19.